Unlock end-to-end observability insights with Dynatrace PurePath 4 seamless integration of OpenTracing for Java Read now
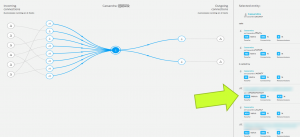
Simplify troubleshooting with AI-powered insights into connection pool performance (Early Adopter) Read now
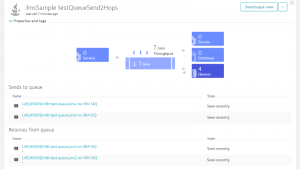
Transform IBM Z applications into Java services with end-to-end transaction visibility and anomaly detection (Preview) Read now