
Memory and Garbage Collection problems are still the most prominent issues in any java application. One of the reasons is that the very nature of Garbage Collection is often misunderstood. This prompted me to write a summary of some of the most frequent and also most obscure memory related issues that I have encountered in my time. I will cover the causes of memory leaks, high memory usage, class loader problems and GC configuration and how to detect them. We will begin this series with the best known one – memory leaks.
Memory Leaks
A memory leak is the most-discussed java memory issue there is. Most of the time people only talk about growing memory leaks, that is the continuous rise of leaked objects. They are in comparison, the easiest to track down as you can look at trending or histogram dumps.
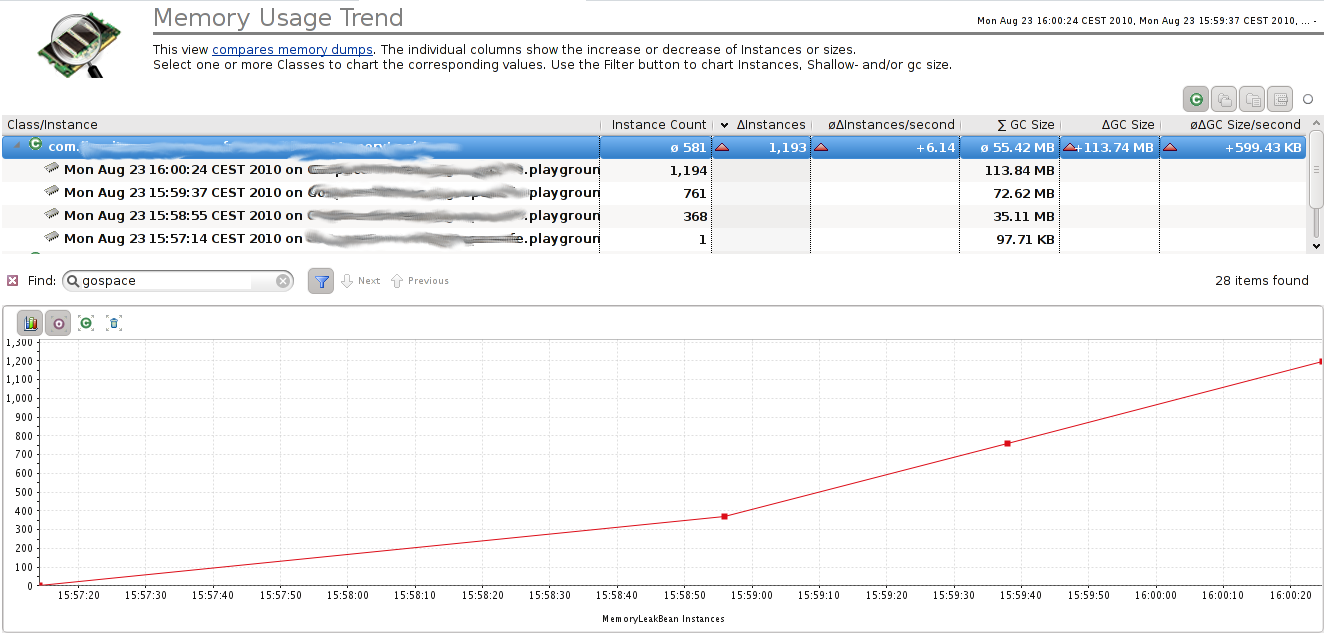
In the picture we see the Dynatrace trending dump facility. You can achieve similar results manual by using jmap -histo <pid> multiple times and compare the results. Single object leaks are less thought about. As long as we have enough memory they seldom pose a serious problem. From time to time though there are single object leaks that occupy a considerable amount of memory and become a problem. The good news is that single big leaks are easily discovered by todays heap analyzer tools, as they concentrate on that.
Lastly there is also the particularly nasty, but in reality rarely, seen version of a lot of small, unrelated memory leaks. It’s theoretically possible, but in reality it would need a lot of seriously bad programmers working on the same project. So let’s look at the most common causes for memory leaks.
Thread Local Variables
ThreadLocals are used to bind a variable or a state to a thread. Each thread has its own instance of the variable. They are very useful but also very dangerous. They are often used to track a state, like the current transaction id, but sometimes they hold a little more information. A thread local variable is referenced by its thread and as such its lifecycle is bound to it. In most application servers threads are reused via thread pools and thus are never garbage collected. If the application code is not carefully clearing the thread local variable you get a nasty memory leak.
These kind of memory leaks can easily be discovered with a heap dump. Just take a look at the ThreadLocalMap in the heap dump and follow the references.

- The heapdump shows that over 4K objects which amount to about 10MB are held by thread locals
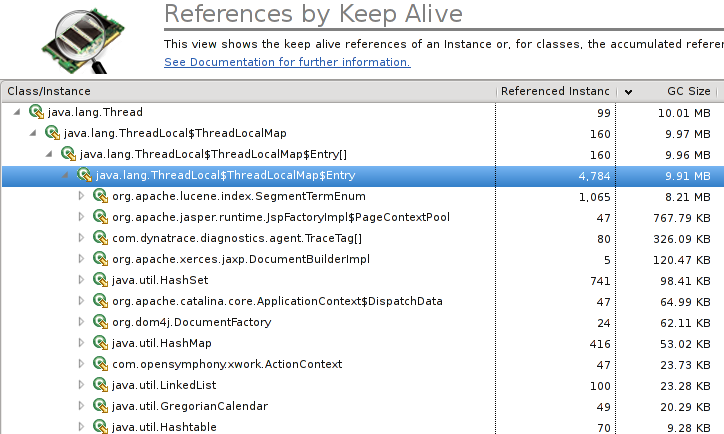
You can then also look at the name of the thread to figure out which part of your application is responsible for the leak.
Mutable static fields and collections
The most common reason for a memory leak is the wrong usage of statics. A static variable is held by its class and subsequently by its classloader. While a class can be garbage collected it will seldom happen during an applications lifetime. Very often statics are used to hold cache information or share state across threads. If this is not done diligently it is very easy to get a memory leak. Especially static mutable collections should be avoided at all costs for just that reason. A good architectural rule is not to use mutable static objects at all, most of the time there is a better alternative.
Circular and complex bi-directional references
This is my favorite memory leak. It is best explained by example:
org.w3c.dom.Document doc = readXmlDocument();

org.w3c.dom.Node child = doc.getDocumentElement().getFirstChild();

doc.removeNode(child);

doc = null;
At the end of the code snippet we would think that the DOM Document will be garbage collected. That is however not the case. A DOM Node object always belongs to a Document. Even when removed from the Document the Node Object still has a reference to its owning document. As long as we keep the child object the document and all other nodes it contains will not be garbage collected. I’ve see this and other similar issues quite often.
JNI memory leaks
This is a particularly nasty form or memory leak. It is not easily found, unless you have the right tool and it is also not known to a lot of people. JNI is used to call native code from java. This native code can handle, call and also create java objects. Every java object created in a native method begins its life as a so called local reference. That means that the object is referenced until the native method returns. We could say the native method references the java object. So you don’t have a problem unless the native method runs forever. In some cases you want to keep the created object even after the native call has ended. To achieve this you can either ensure that it is referenced by some other java object or you can change the local reference into a global reference. A global reference is a GC root and will never be garbage collected until explicitly deleted by the native code. The only way to discover such a memory leak is to use a heap dump tool that explicitly shows global native references. If you have to use JNI you should rather make sure that you reference these objects normally and forgo global references altogether.
You can find this sort of leak when your heap dump analysis tool explicitly marks the GC Root as a native reference, otherwise, you will have a hard time.
Wrong implementation of equals/hashcode
It might not be obvious on the first glance, but if your equals/hashcode methods violate the equals contract it will lead to memory leaks when used as a key in a map. A HashMap uses the hashcode to lookup an object and verify that it found it by using the equals method. If two objects are equal they must have the same hashcode, but not the other way around. If you do not explicitly implement hashcode yourself this is not the case. The default hashcode is based on object identity. Thus using an object without a valid hashcode implementation as a key in a map, you will be able to add things but you will not find them anymore. Even worse if you re-add it, it will not overwrite the old item but really add a new one. And just like that, you have memory leak. You will find it easily enough as it is growing, but the root cause will be hard to determine unless you remember this one.
The easiest way to avoid this is to use unit testcases and one of the available frameworks that tests the equals contract of your classes (e.g. https://github.com/jqno/equalsverifier).
Classloader Leaks
When thinking about memory leaks we think mostly about normal java objects. Especially in application servers and OSGi containers, there is another form of memory leak, the class loader leak. Classes are referenced by their classloader and normally they will not get garbage collected until the classloader itself is collected. That however only happens when the application gets unloaded by the application server or OSGi container. There are two forms of Classloader Leaks that I can describe off the top of my head.
In the first an object whose class belongs to the class loader is still referenced by a cache, a thread local or some other means. In that case, the whole class loader, meaning the whole application cannot be garbage collected. This is something that happens quite a lot in OSGi containers nowadays and used to happen in JEE Application Servers frequently as well. As it is only happens when the application gets unloaded or redeployed it does not happen very often.
The second form is nastier and was introduced by bytecode manipulation frameworks like BCEL and ASM. These frameworks allow the dynamic creation of new classes. If you follow that thought you will realize that now classes, just like objects, can be forgotten by the developer. The responsible code might create new classes for the same purpose multiple times. As the class is referenced in the current class loader you get a memory leak that will lead to an out of memory in the permanent generation. The real bad news is that most heap analyzer tools do not point out this problem either, we have to analyze it manually, the hard way. This form or memory leak became famous due to an issue in an older version of hibernate and its usage of CGLIB.
Summary
As we see there are many different causes for memory leaks and not all of them are easy to detect. In my next post I will look at further java memory problems, so stay tuned.


Looking for answers?
Start a new discussion or ask for help in our Q&A forum.
Go to forum