

Java performance tuning
Deeply understand your Java performance
The most common Java performance problems and how to fight them
Slow or excessive SQL queries; wrongly configured connection pools, excessive service, REST and remoting calls; overhead through excessive logging or inefficient exception handling; bad coding leading to CPU Hotspots and Memory Leaks are some of the most common Java performance problems.
Monitor transactions across JVMs and all other tiers. Auto-model your application. Visualize what dependencies exist with other JVMs, where time is spent, and where problems exist. Improve Java performance by instantly drilling down into method level details to see method arguments, return values, SQL statements, exceptions or log messages.
Java performance tuning with Dynatrace
Tune your Java performance by taking a deep look into the bytecode of your app.
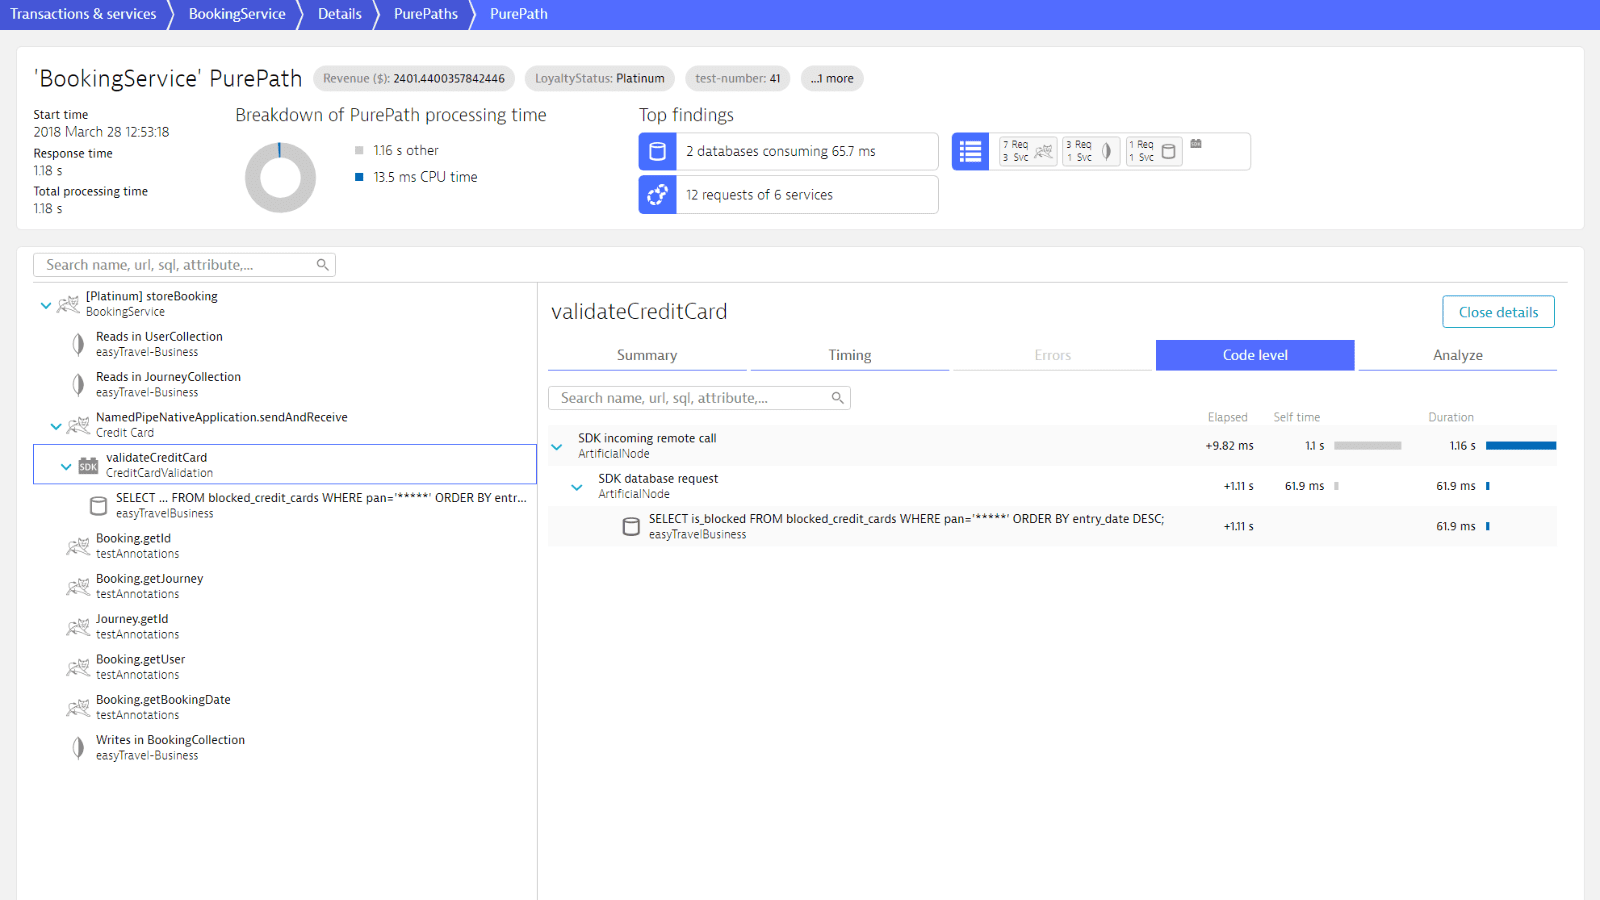
- Capture timing and code-level context for every transaction.
- Drill down into all services and components called upon a single user interaction.
- Analyze response times and find hotspots at the method level.
- Analyze execution frequencies, response times, and long-running queries to JDBC-backed databases like MySQL, SQL Server, PostgreSQL and Oracle, as well as NoSQL databases like Cassandra and MongoDB.
- Understand the impact of methods and database statements on user experience.
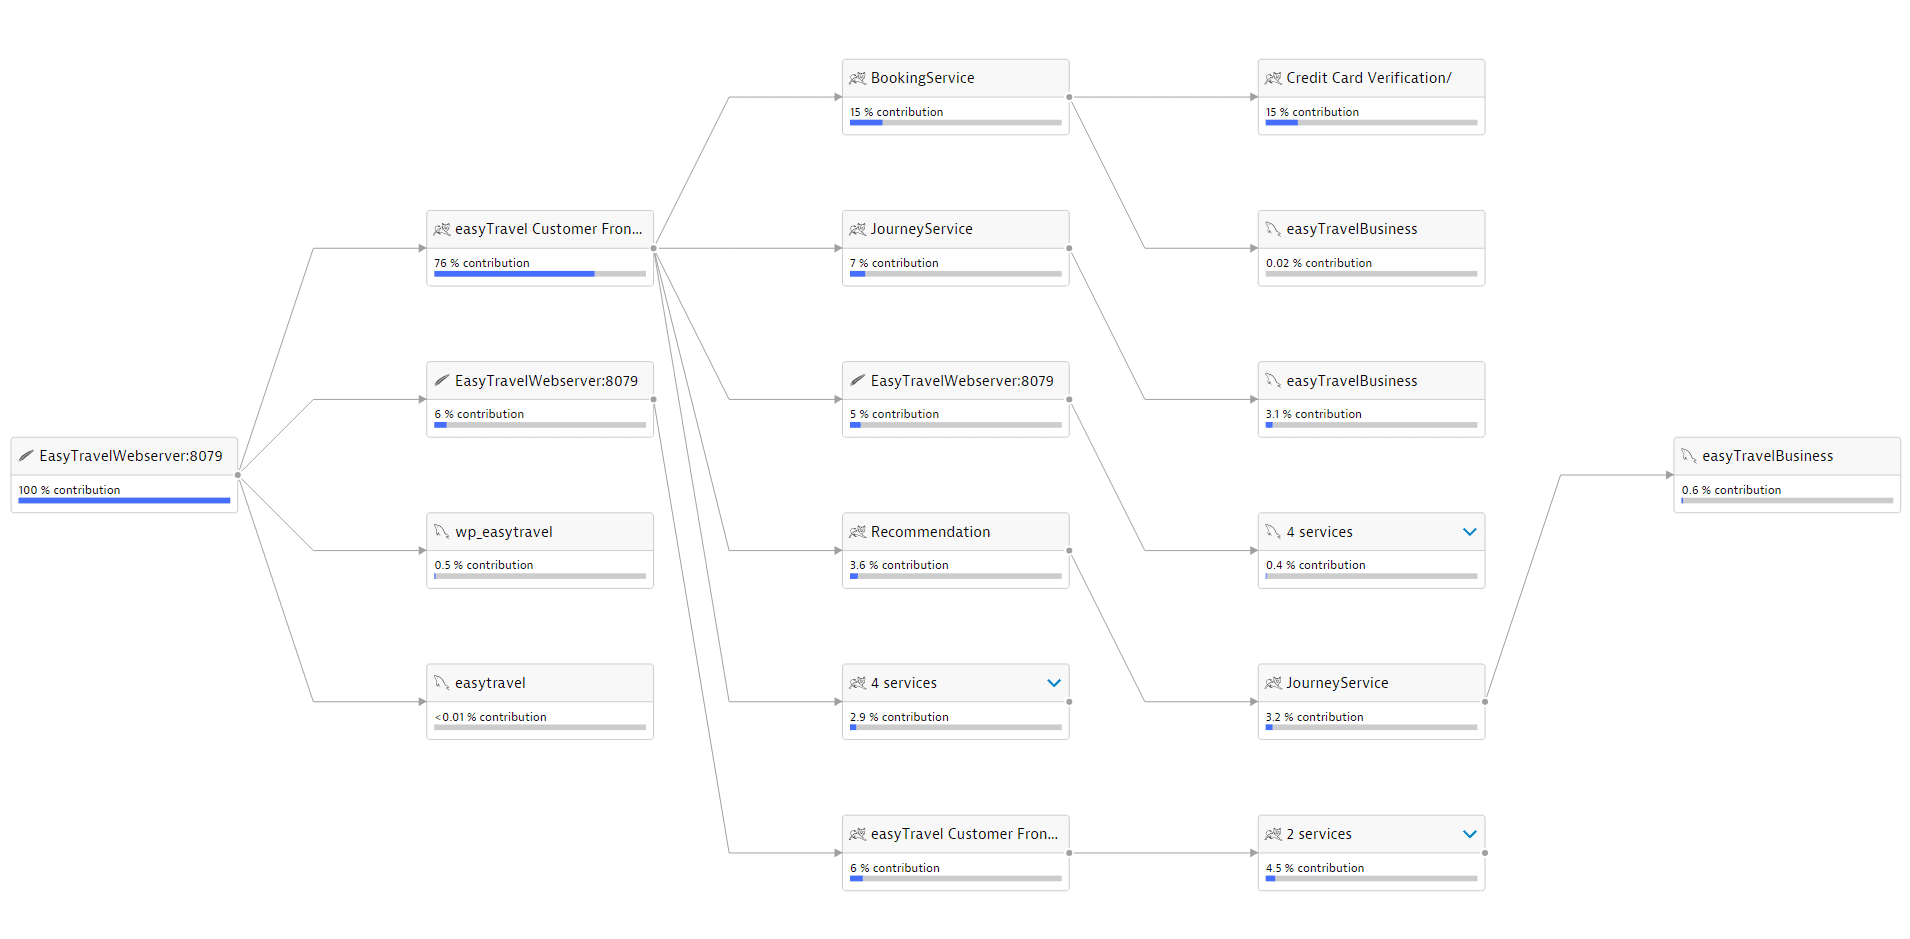
Auto-discover and map all applications and business transactions-flows of your Java application continuously end-to-end.
Dynatrace PurePath Technology captures timing and code-level context for every transaction, across every tier, without gaps or blind spots.

The service flow visualizes service requests end-to-end.
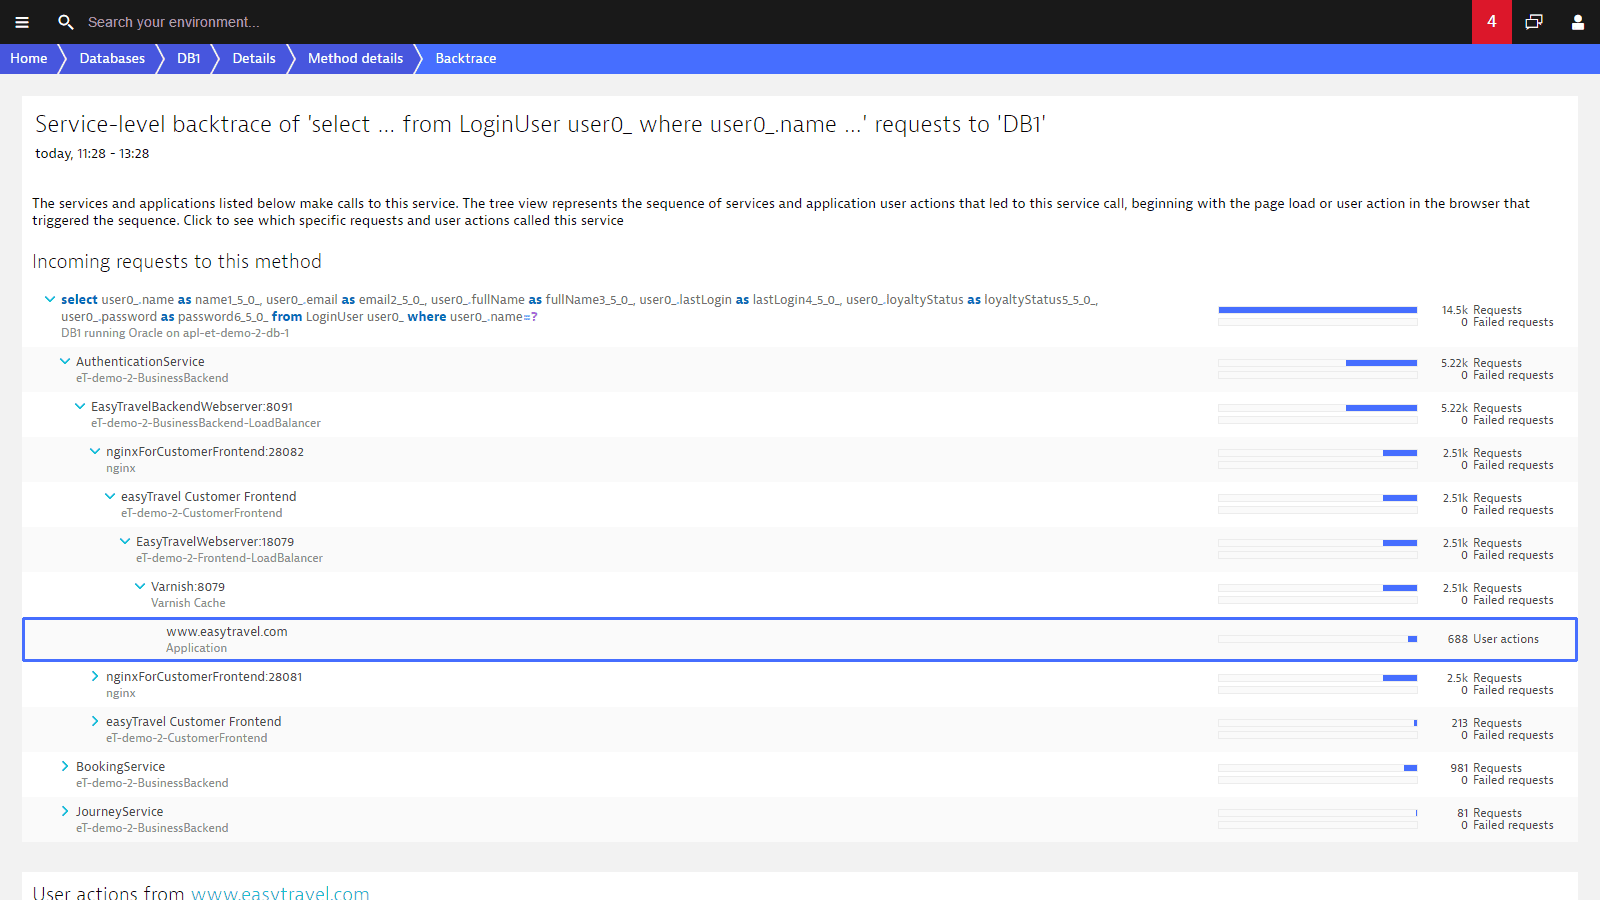
Understand where service calls originate in your Java code.
Learn how to tune Java performance
-
Free e-book: Java enterprise performance
- Understand Java memory management
- Read about Java performance engineering
- Understand performance monitoring in virtualized and cloud environments
-
Blog: Boost Java application performance (almost) automatically
- Learn to configure your Java VM correctly
- Speed up a complex Java application by more than 10% in a few simple steps without changing code
-
Blog: How Garbage Collection differs in the three big JVMs
- See what makes the three big JVMs unique
- Ensure that Garbage Collection is running smooth
-
Blog: The top Java memory problems – Part 1
- Understand the difference between Java memory leak types
- See how to detect the root-cause of each type
-
Blog: The top Java memory problems – Part 2
- Understand why Java memory usage is still a frequent problem in today’s enterprise applications.
- Learn to detect the root-cause of them
- Understand why Java memory usage is still a frequent problem in today’s enterprise applications.
-
Blog: How to identify a Java memory leak
- Learn how to identify Java memory leaks
- See how the Heap size influences Garbage Collection activity
- See how Dynatrace correlates JVM metrics, compares GC suspension times with CPU usage, or network traffic outages
- Learn how to identify Java memory leaks
Try it free
See our unified observability and security platform in action.


