Dynatrace Blog
Modern cloud done right. Innovate faster and compete more effectively in the digital age.


Dynatrace completed Data Privacy Framework self-certification

Generative AI poised to have impact by automating software development, report says

The State of DevOps Automation assessment: How automated are you?
Automate your work with unified observability and custom solutions

How observability, application security, and AI enhance DevOps and platform engineering maturity
Experiencing Perform: The diary of a Developer Advocate

Enable full observability for Linux on IBM Z mainframe now with logs

Shift right in software development: Adapting observability for a seamless development experience

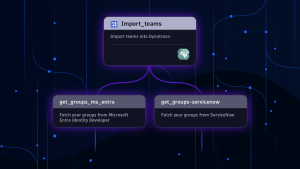
Unlock seamless access: The power of flexible identity federation

Protecting critical infrastructure and services: Ensure efficient, accurate information delivery this election year

Predictable growth with a simplified partner compensation structure: A new economic model

Dynatrace SaaS release notes version 1.289

Efficient SLO event integration powers successful AIOps

Breaking barriers: One woman’s journey to thriving in the tech world

A look at the GigaOm 2024 Radar for Cloud Observability

Security operations centers: How state governments can enhance cybersecurity posture

The 3 biggest mistakes you can make when moving to Kubernetes

Dynatrace Managed release notes version 1.288

Fueling the next wave of IT operations: Modernization with generative AI

Enhancing Kubernetes cluster management key to platform engineering success
Google Cloud Next 2024: AI innovation for Google Cloud
Why business digital transformation is still a key C-level priority today
The right person at the right time makes all the difference: Best practices for ownership information