
Dynatrace Blog
Modern cloud done right. Innovate faster and compete more effectively in the digital age.

Beyond uptime: Unveiling the improved Dynatrace SLA
Simplified image management: Dive into our end-to-end Harbor and Jenkins integration
The Dynatrace journey toward DORA compliance

Dynatrace completed Data Privacy Framework self-certification

Generative AI poised to have impact by automating software development, report says

The State of DevOps Automation assessment: How automated are you?

Dynatrace SaaS release notes version 1.290
Automate your work with unified observability and custom solutions

How observability, application security, and AI enhance DevOps and platform engineering maturity
Experiencing Perform: The diary of a Developer Advocate

Enable full observability for Linux on IBM Z mainframe now with logs

Shift right in software development: Adapting observability for a seamless development experience

Unlock seamless access: The power of flexible identity federation

Protecting critical infrastructure and services: Ensure efficient, accurate information delivery this election year

Predictable growth with a simplified partner compensation structure: A new economic model
Dynatrace SaaS release notes version 1.289

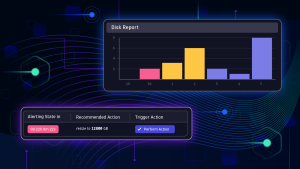
Efficient SLO event integration powers successful AIOps

Breaking barriers: One woman’s journey to thriving in the tech world

A look at the GigaOm 2024 Radar for Cloud Observability

Security operations centers: How state governments can enhance cybersecurity posture

The 3 biggest mistakes you can make when moving to Kubernetes

Dynatrace Managed release notes version 1.288

Fueling the next wave of IT operations: Modernization with generative AI