

Digital Experience
Improve user experiences with best-in-class digital experience monitoring. Ensure every application is available, functional, fast, and efficient across every channel including mobile, web, IoT, and APIs.
Instantly analyze digital experience data with full context
Unify, store, and contextually analyze massive volumes of digital experience data with speed and cost-efficiency using a causational data lakehouse.
Application insights and availability
Gain deeper insight into the digital experience of your applications and deliver a better end-user experience through root cause analysis with tracing, logs, and metrics in context, including logs connected directly to user sessions.

Interactive tour
Hear what your users are telling you
Stop guessing. Start optimizing. We use observability and advanced AIOps on a unified platform to give teams the precise, automated insights and context they need to proactively deliver better customer experiences and drive better business outcomes.
Take an interactive tour of the Dynatrace platform to see how.


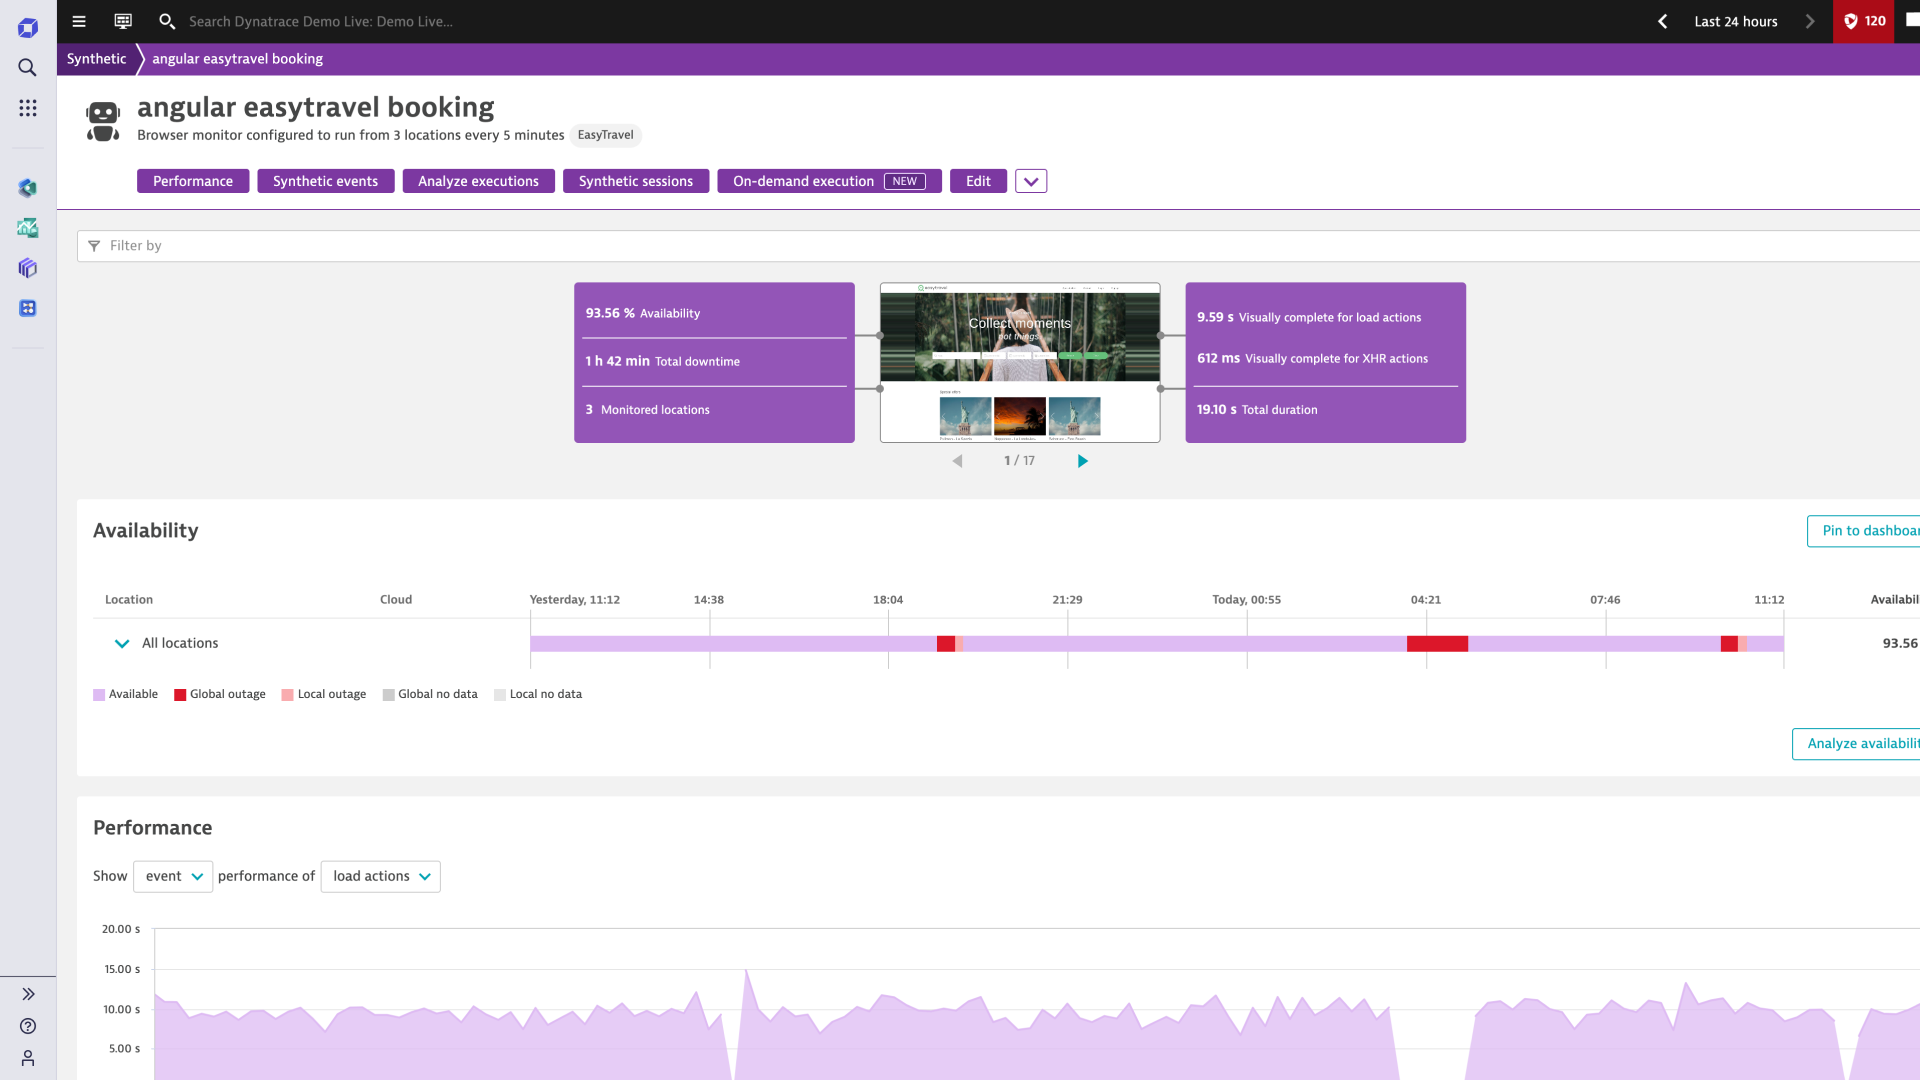
Prevent problems before users see them
With synthetic monitoring, automatically discover problems across production and development environments before your customers are affected and begin to overload your call centers with complaints.
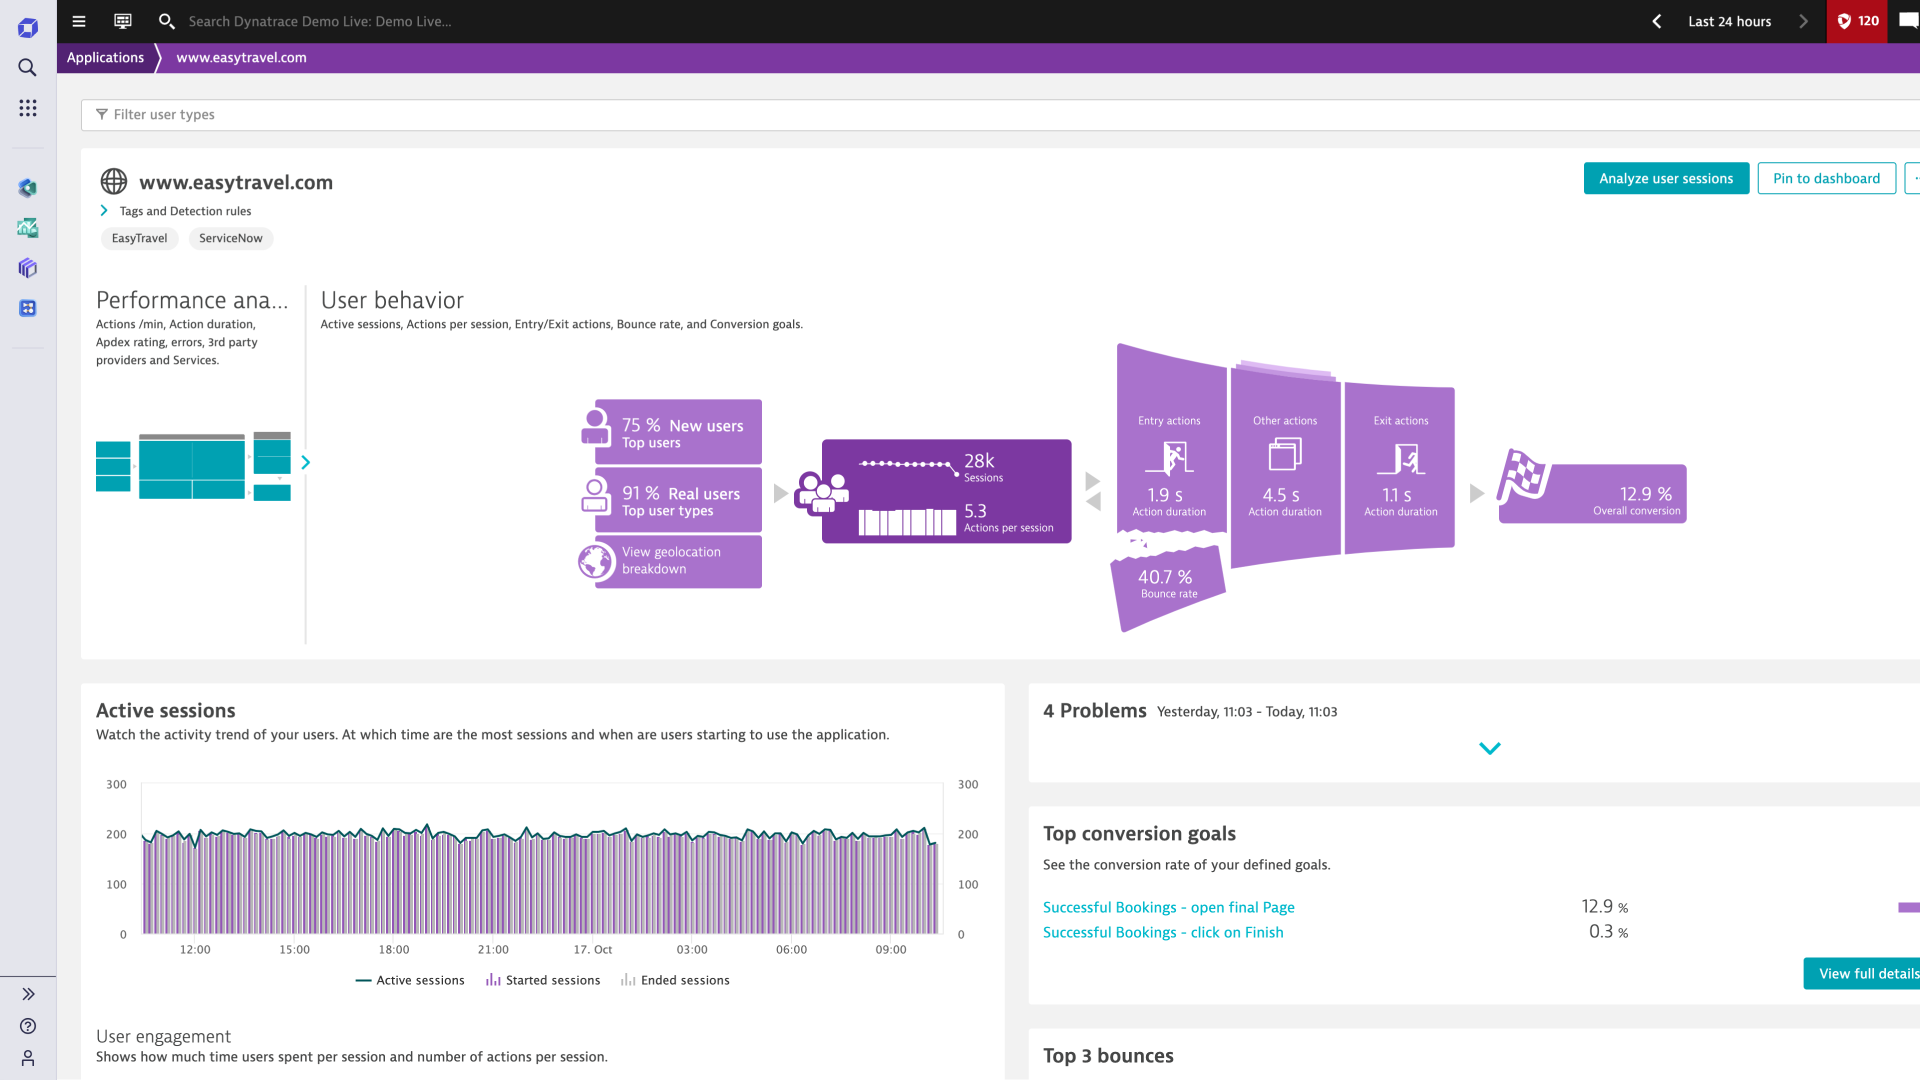
Automatically resolve real user-impacting issues
With real-user monitoring, instantly know when user experiences go wrong and how you can rapidly fix them, so you can eliminate the guesswork.
Dynatrace is a G2 Leader in Digital Experience Monitoring (DEM)
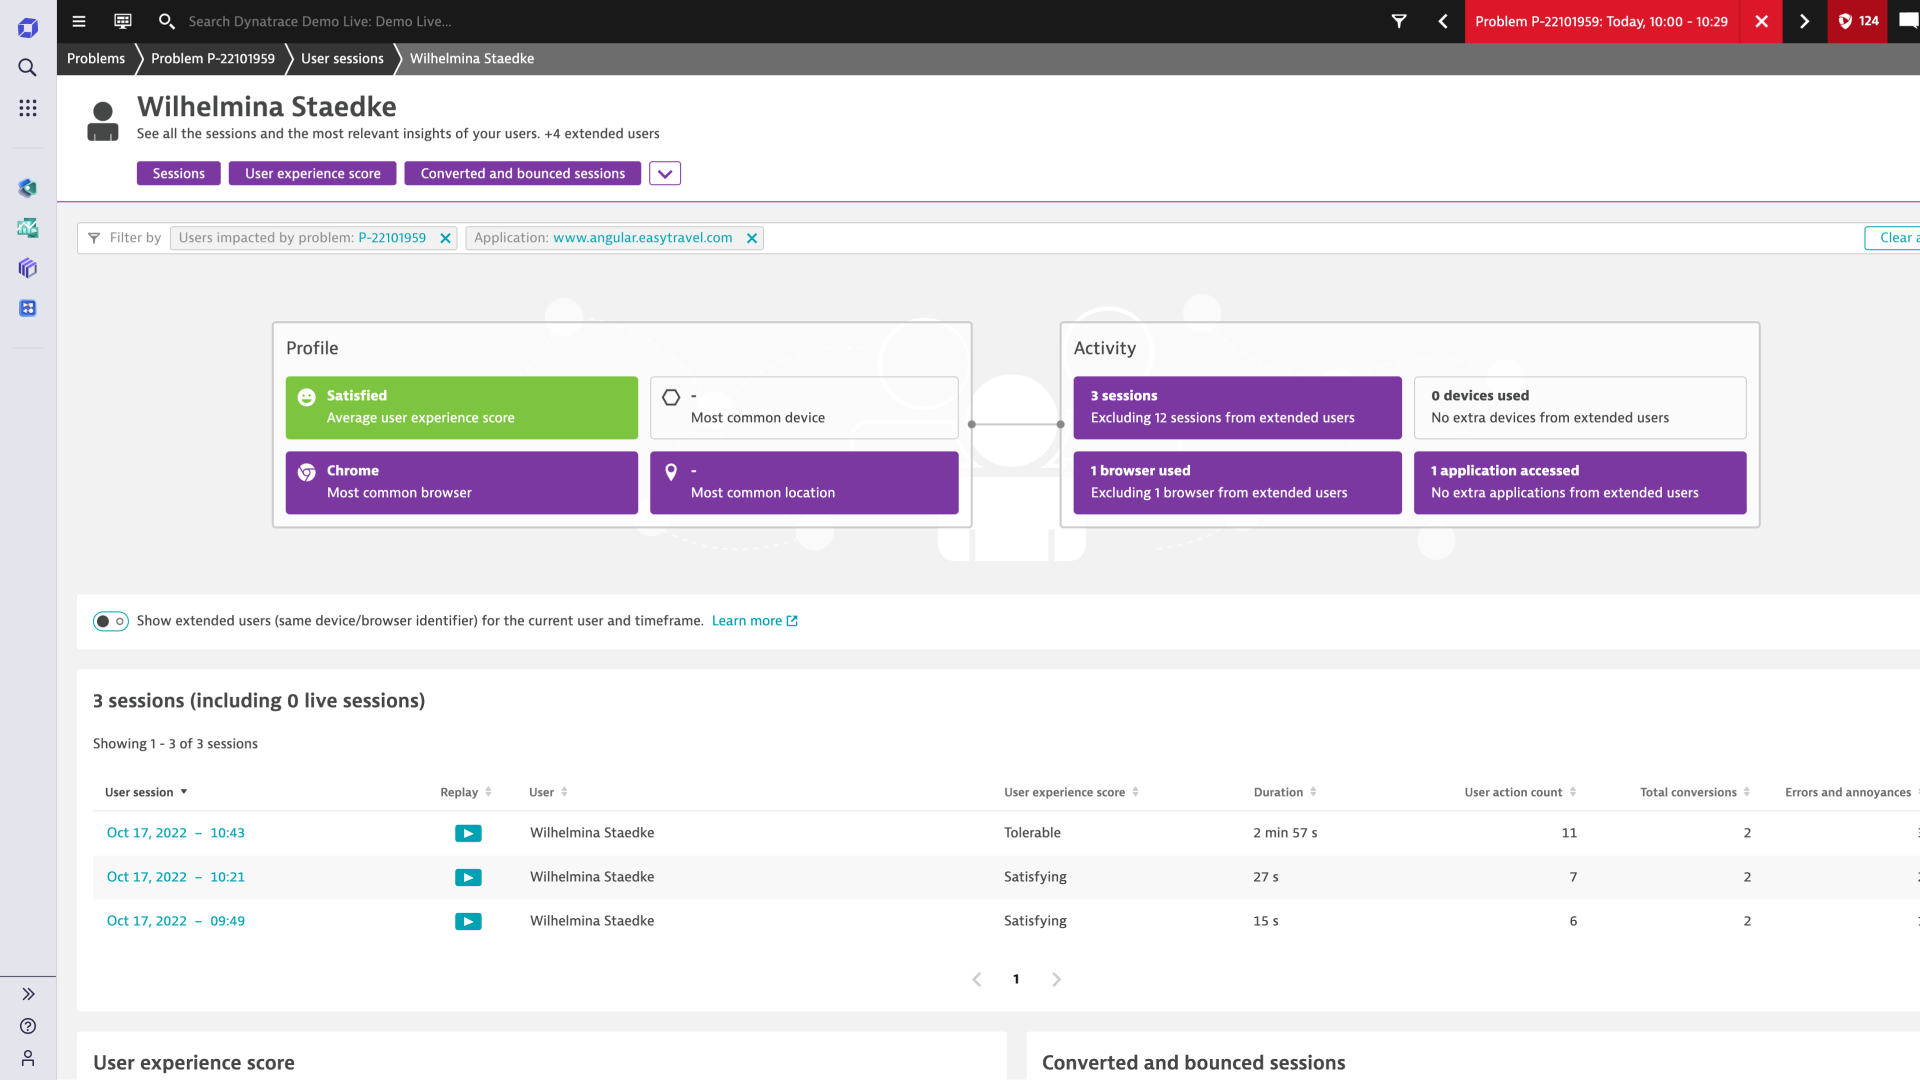
Indisputable video evidence to optimize user experiences
Replay every session through the eyes of the user and understand their exact experience, so everyone can agree where to make improvements.
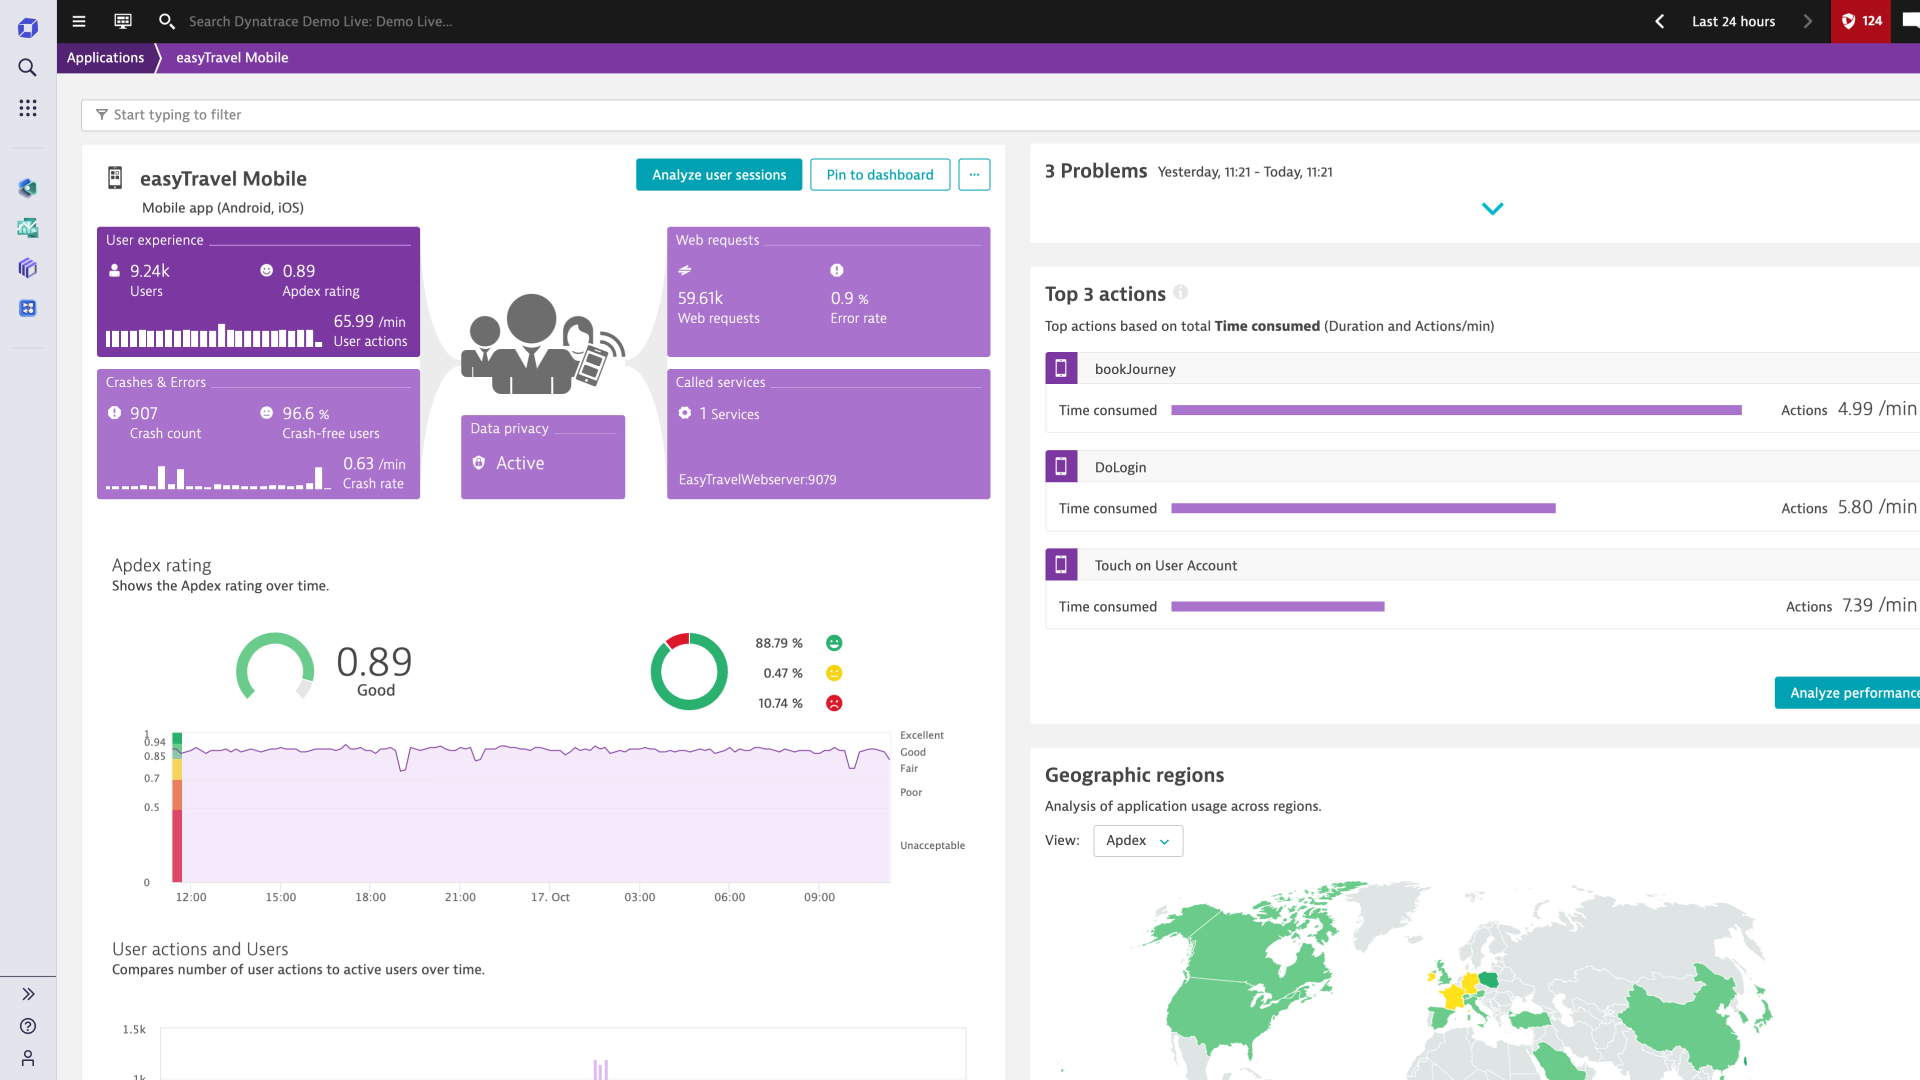
Advanced mobile app monitoring to deliver omni-channel experiences
Continuously monitor and analyze mobile user experiences across customer segments, app crashes, third party components, and your entire cloud stack to innovate faster with new mobile features that exceed customer expectations.
Push the boundaries of understanding user journeys
Leverage logs as a critical ingredient to manage and improve application environments so developers can proactively optimize their apps by tackling unforeseen issues that can manifest in production.


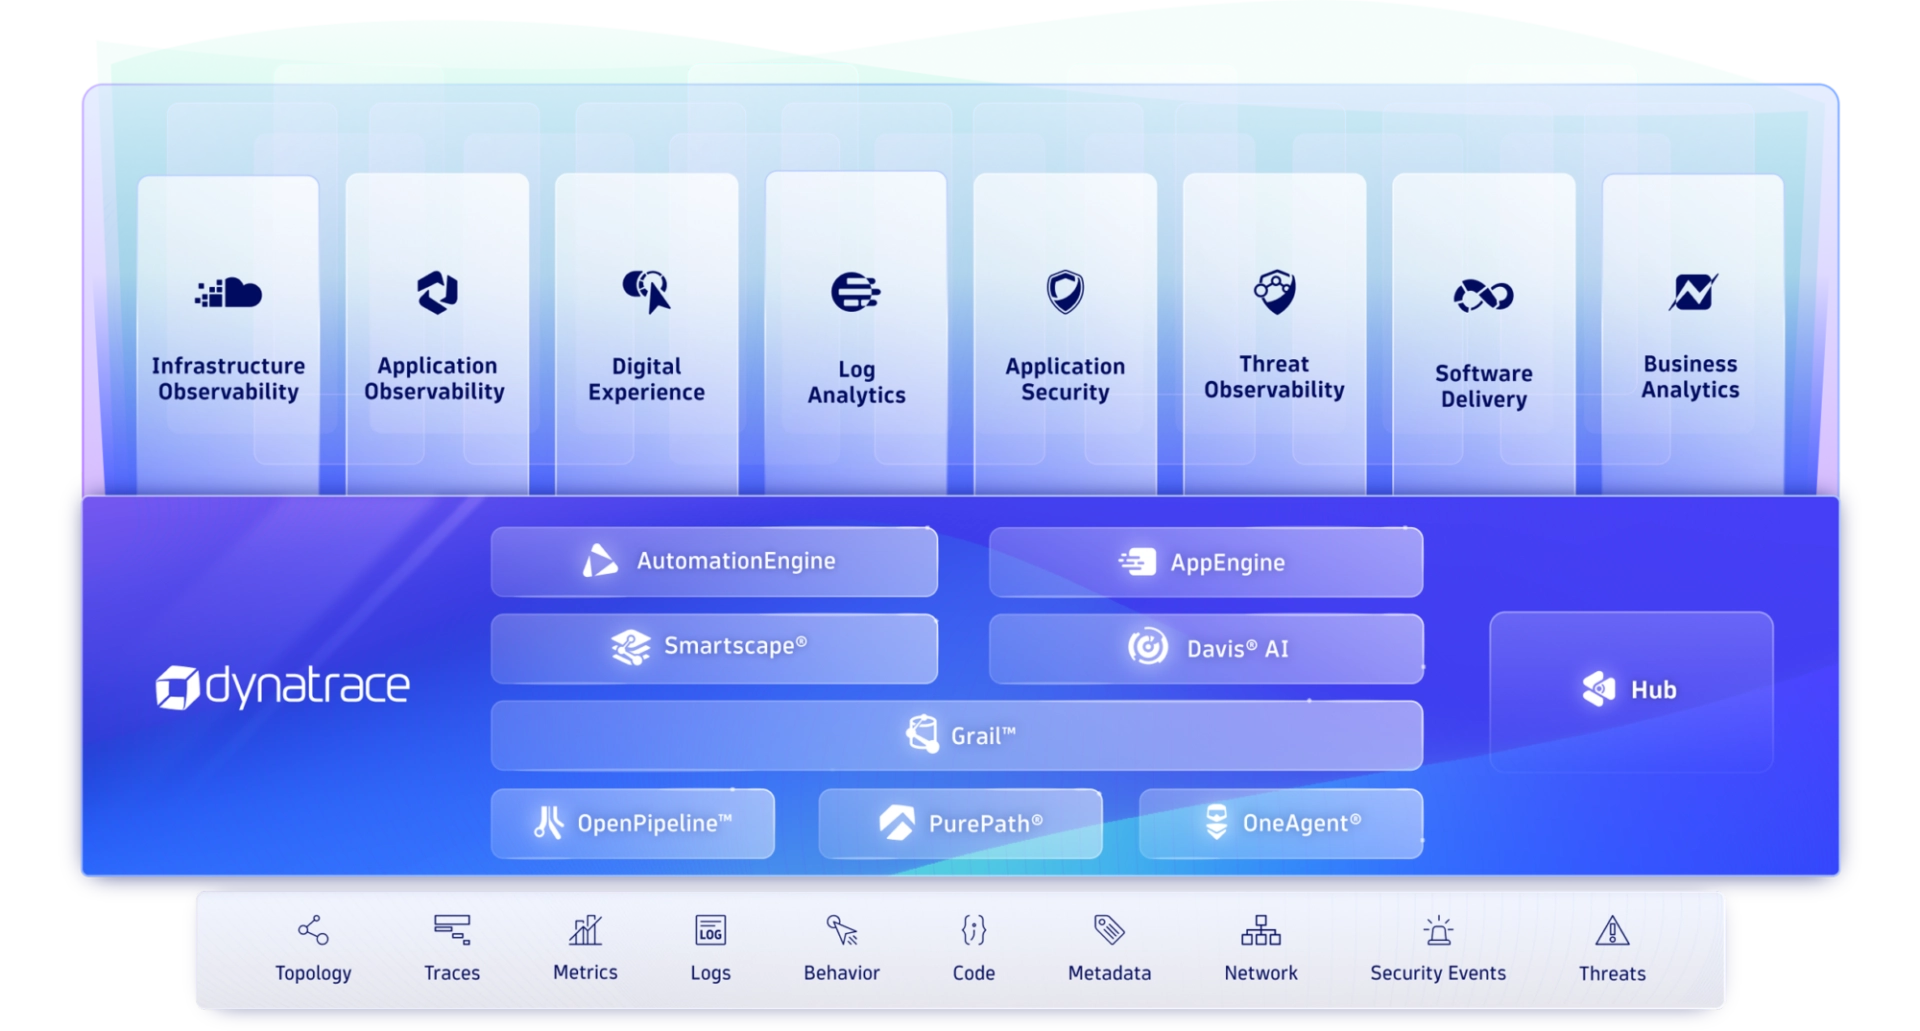
Powerful core technologies
Get precise answers and automation through hypermodal AI, with automatic discovery and topology mapping across billions of dependencies.
-
Davis AI
Our hypermodal AI uniquely combines predictive AI, causal AI, and generative AI. Davis® AI uses high-fidelity topology, metrics, traces, logs, and user data to deliver precise answers, intelligent automation, and AI recommendations.
-
AutomationEngine
Our answer-driven automation technology leverages causal AI to intelligently power BizDevSecOps workflows throughout multicloud ecosystems.
-
AppEngine
Our secure, serverless, auto-scaling runtime environment makes it easy to create custom, compliant, data-driven apps that address the use cases most important to you.
-
Grail
Our massively parallel processing (MPP) data lakehouse is purpose-built to ingest, store, and run lightning-fast analytics on observability, security, and business data with high performance and at scale.
-
Smartscape
Our dynamic topology mapping technology automatically identifies and maps interactions and relationships between applications and the underlying infrastructure. As new microservices come up or go away, the Smartscape topology map continuously updates in real-time.
-
OpenPipeline
Our high-performance stream processing is designed to ingest, process, enrich, contextualize, and persist data from any source, in any format, at any scale.
-
OneAgent
Our single agent technology deploys only once on a host and instantly starts collecting all relevant metrics along the full application-delivery chain. Install it and forget it—we take care of everything.
-
PurePath
Our patented distributed tracing and code-level analysis technology automatically integrates high-fidelity distributed tracing with user experience data and data from open-source technologies including OpenTelemetry and code-level analytics.


End-to-end observability through one unified platform
See how we cover it all in one automatic, AI-powered platform.
Try it free

A Leader in the 2023 Gartner® Magic Quadrant™ and ranked #1 in the Critical Capabilities for APM and Observability reports
See why we’re positioned furthest for Vision and highest for Execution in the Magic Quadrant, and ranked #1 in all Use Cases in the Critical Capabilities Report for Application Performance Monitoring and Observability.


