Dynatrace Blog
Modern cloud done right. Innovate faster and compete more effectively in the digital age.

Automate your work with unified observability and custom solutions

How observability, application security, and AI enhance DevOps and platform engineering maturity
Experiencing Perform: The diary of a Developer Advocate

Enable full observability for Linux on IBM Z mainframe now with logs

Shift right in software development: Adapting observability for a seamless development experience

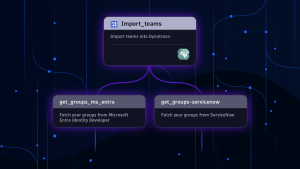
Unlock seamless access: The power of flexible identity federation

Protecting critical infrastructure and services: Ensure efficient, accurate information delivery this election year

Predictable growth with a simplified partner compensation structure: A new economic model

Dynatrace SaaS release notes version 1.289

Efficient SLO event integration powers successful AIOps

Breaking barriers: One woman’s journey to thriving in the tech world

A look at the GigaOm 2024 Radar for Cloud Observability

Security operations centers: How state governments can enhance cybersecurity posture
The 3 biggest mistakes you can make when moving to Kubernetes

Dynatrace Managed release notes version 1.288

Fueling the next wave of IT operations: Modernization with generative AI
Enhancing Kubernetes cluster management key to platform engineering success
Google Cloud Next 2024: AI innovation for Google Cloud
Why business digital transformation is still a key C-level priority today
The right person at the right time makes all the difference: Best practices for ownership information
Overseeing SaaS security with AWS AppFabric and Dynatrace

How AI and observability help to safeguard government networks from new threats
Tech Transforms podcast: The path forward for AI in the government